

Project Report
The Project Report module in Abstract ONE helps you analyze project-wise lead performance for a selected project. It shows lead summary counts, source distribution, lead type breakdown, disposition status, conversion trends, site visit analytics, and top-performing campaigns and users.
From Project Report, you can:
- Select a project and date range to analyze performance
- View lead summary and closed lead breakdown
- Analyze leads by source, lead type, and disposition
- Track lead conversion ratio and site visit analytics
- Review top-performing campaigns and users for the project
- Export project report data to Excel
- Filter report data by date, source, campaign, and users
Access Project Report
Go to:
Sidebar → Advance Report → Project Report
The Project Report page opens by default.
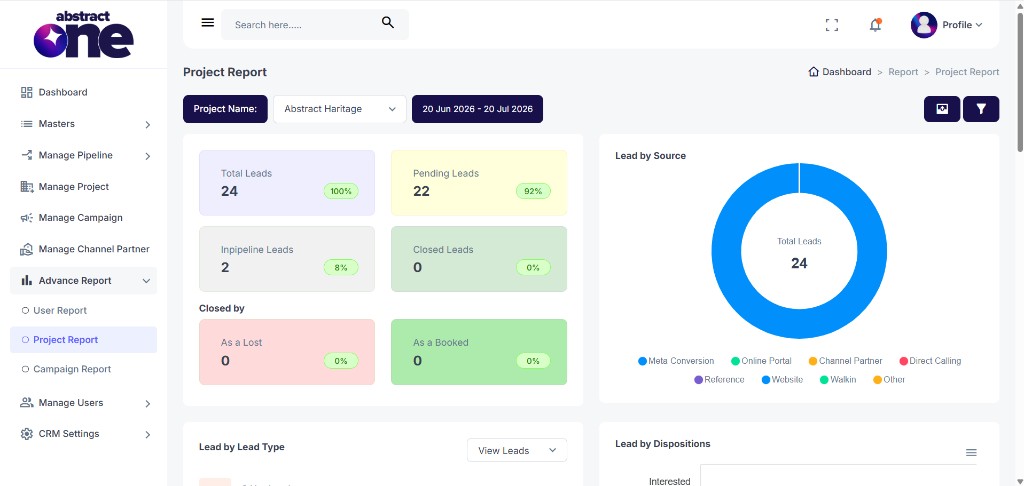
Project Report Header Controls
At the top of the page, use these controls to configure the report view:
| Control | Description |
|---|---|
| Project Name | Select the project for which you want to view performance |
| Date Range | Shows the active report period (e.g. 20 Jun 2026 - 20 Jul 2026) |
| Export | Download project report data |
| Filter | Open the Filter Project Report drawer |
Lead Summary Cards
The summary section displays high-level lead metrics for the selected project:
| Card | Description |
|---|---|
| Total Leads | Total leads generated for the selected project |
| Pending Leads | Leads that are not yet attempted or processed |
| Inpipeline Leads | Leads currently in active pipeline stages |
| Closed Leads | Leads marked as closed in the selected period |
Closed By Breakdown
Below the summary cards, the Closed by section shows how closed leads were finalized:
- As a Lost — leads closed as lost
- As a Booked — leads closed as booked
Lead by Source
The donut chart shows lead distribution by source for the selected project, such as Meta Conversion, Online Portal, Channel Partner, Direct Calling, Reference, Website, Walkin, and Other.
The center of the chart displays the total lead count for quick reference.
Lead by Lead Type
This widget categorizes project leads by temperature:
- Hot Leads
- Cold Leads
- Warm Leads
- Dead Leads
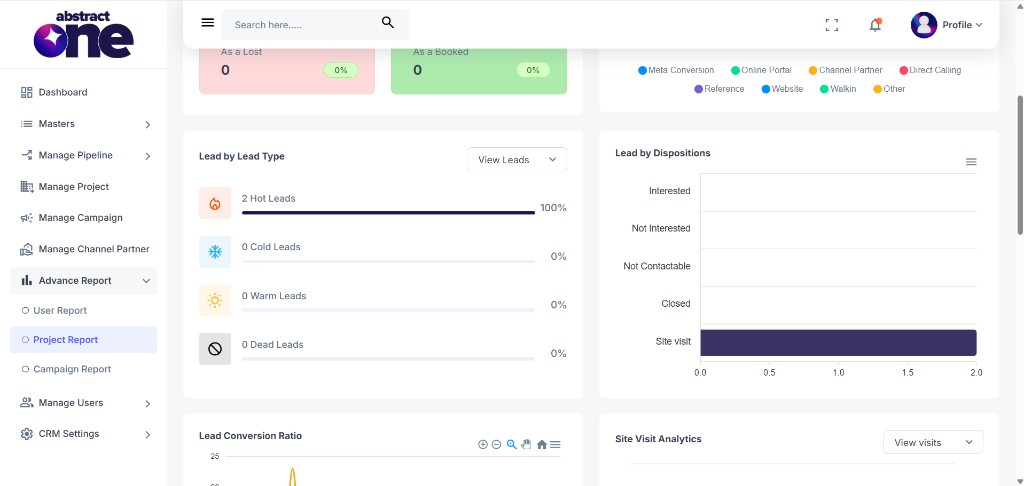
Each row shows lead count and percentage share. Use the View Leads dropdown to drill down into lead details.
Lead by Dispositions
The horizontal bar chart shows disposition-wise lead status such as Interested, Not Interested, Not Contactable, Closed, and Site visit.
Lead Conversion Ratio
The line chart tracks conversion performance over the selected date range. It compares:
- Total Leads
- Qualified Leads
- Qualified Site Visits
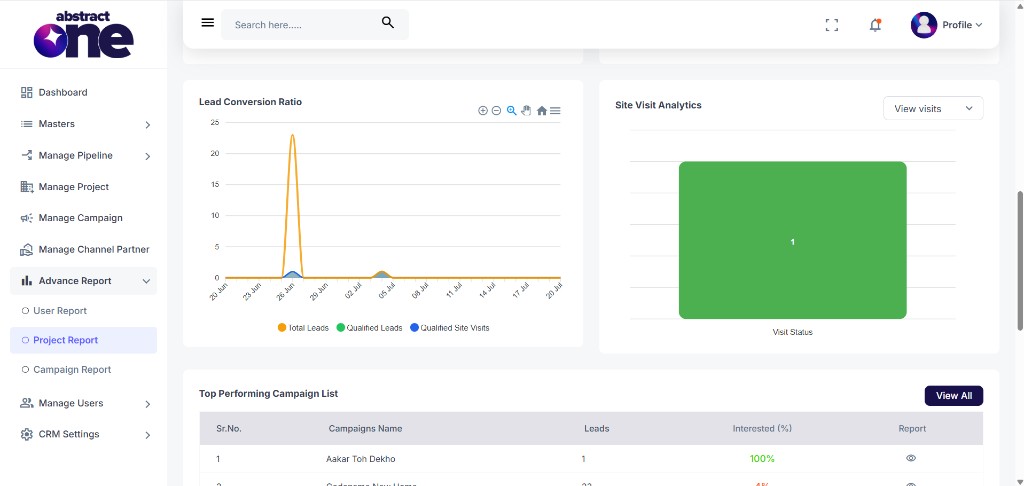
Use the chart toolbar to zoom, pan, reset view, or access additional chart options.
Site Visit Analytics
This section shows site visit performance for the selected project. Use the View visits dropdown to review visit-related details.
The chart displays visit status distribution based on available project data.
Top Performing Campaign List
The Top Performing Campaign List section shows the best-performing campaigns under the selected project.
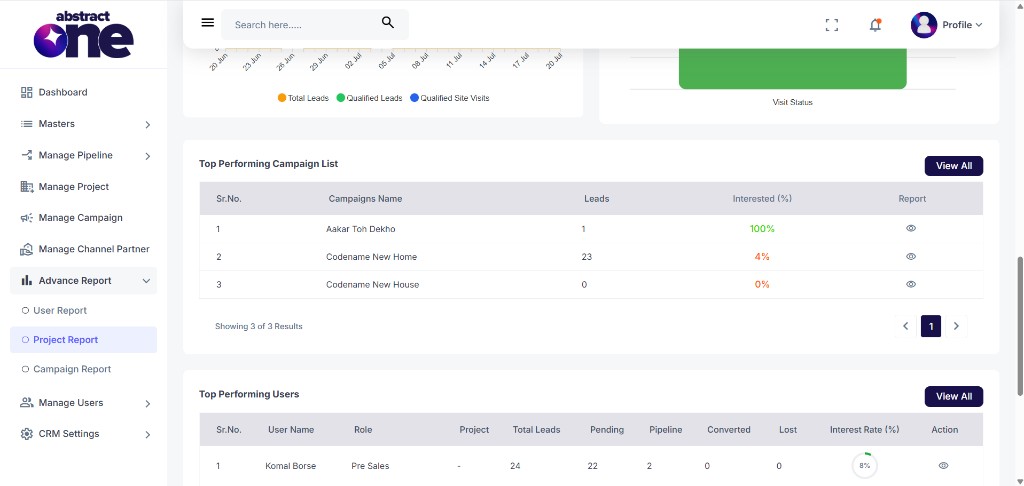
| Column | Description |
|---|---|
| Sr. No. | Serial number of the campaign entry |
| Campaigns Name | Name of the campaign |
| Leads | Total leads generated through the campaign |
| Interested (%) | Interest percentage for the campaign |
| Report | View (eye) icon to open campaign leads |
Click View All to open the User Report page and review all users.
Click the View (eye) icon in the Report column to open the Leads page for that campaign.
Top Performing Users
The Top Performing Users section shows user-wise performance for the selected project.
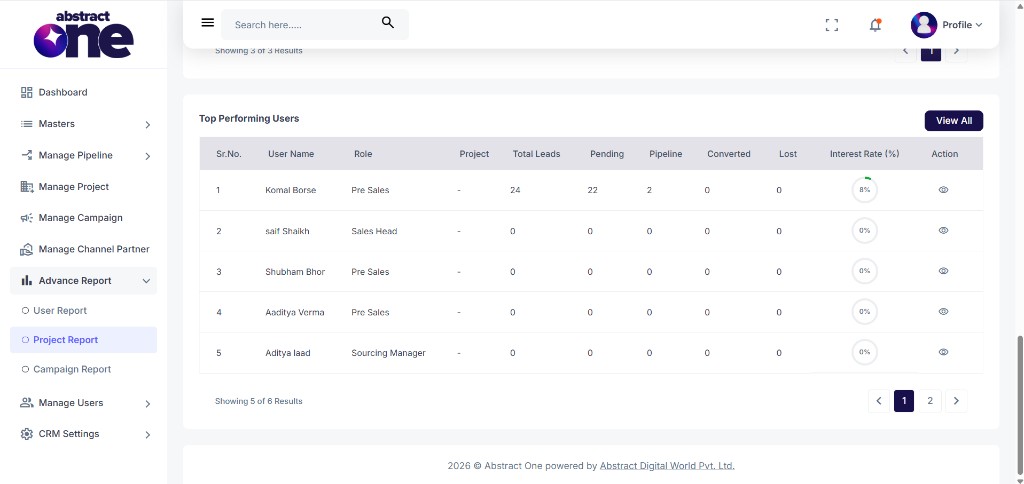
| Column | Description |
|---|---|
| Sr.No. | Serial number of the user entry |
| User Name | Name of the CRM user |
| Role | User role (e.g. Pre Sales, Sales Head) |
| Project | Assigned project |
| Total Leads | Total leads assigned to the user |
| Pending | Pending leads count |
| Pipeline | In pipeline leads count |
| Converted | Converted leads count |
| Lost | Lost leads count |
| Interest Rate (%) | User interest rate shown as a circular indicator |
| Action | View (eye) icon to open user individual report |
Click View All to open the full user report list.
Click the View (eye) icon in the Action column to open the User Individual Report page for that user.
Filter Project Report
Click the Filter icon to open the Filter Project Report drawer.
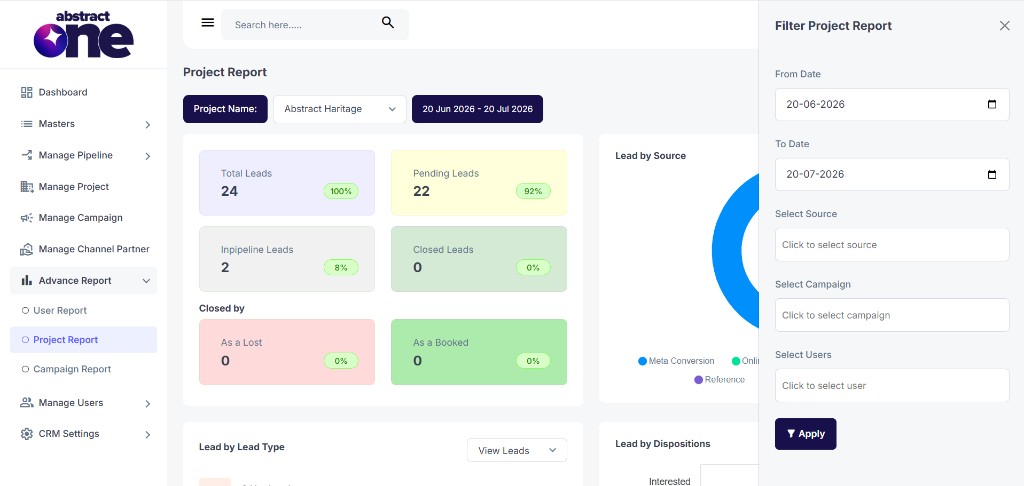
Available filters include:
| Filter | Description |
|---|---|
| From Date | Start date for project report data |
| To Date | End date for project report data |
| Select Source | Filter leads by lead source |
| Select Campaign | Filter report data by campaign |
| Select Users | Filter report data by one or more users |
Click Apply to refresh all summary cards, charts, and tables based on the selected filters.
Export Project Report
On the Project Report page, click the Export button at the top right (next to the Filter icon) to download the project report in Excel format.
The export uses the currently selected project, date range, and any filters applied before export.
The exported Excel file includes project-wise summary details such as:
- Project Detail (Project Name, Report Period)
- Report Duration (From Date, To Date, Total Days)
- Overview (Total Leads, Pending Leads, Inpipeline Leads, Closed Leads)
- Closed By breakdown (As a Lost, As a Booked)
- Site Visit Report (Scheduled, Re-scheduled, Completed, Cancelled)
- Pipeline Leads Status breakdown
- Top Performing Campaign summary
- Top Performing Users summary
Click the export button to download the Excel file for offline review and sharing.
Important Notes
- Project Report data depends on the selected Project and date range.
- All widgets and tables update when you change project, date range, or applied filters.
- In Top Performing Campaign List, View All opens the User Report page and the eye icon opens the Leads page for that campaign.
- In Top Performing Users, the eye icon opens the User Individual Report page for the selected user.
- Use Lead Conversion Ratio and Site Visit Analytics to track project-level funnel performance.
- Exported Excel report helps share project performance data offline.