

Dashboard
The Dashboard in Abstract ONE gives you a real-time overview of lead performance, source distribution, lead type breakdown, disposition status, and other key CRM metrics. You can filter dashboard data, switch between dashboard views, and customize widgets based on your reporting needs.
From the Dashboard, you can:
- View lead summary counts at a glance
- Analyze leads by date, source, lead type, and disposition
- Filter dashboard data by date, user, project, and campaign
- Switch between available dashboard templates
- Customize dashboard widgets and save your preferred layout
Access Dashboard
Go to:
Sidebar → Dashboard
The Dashboard page opens by default after login.
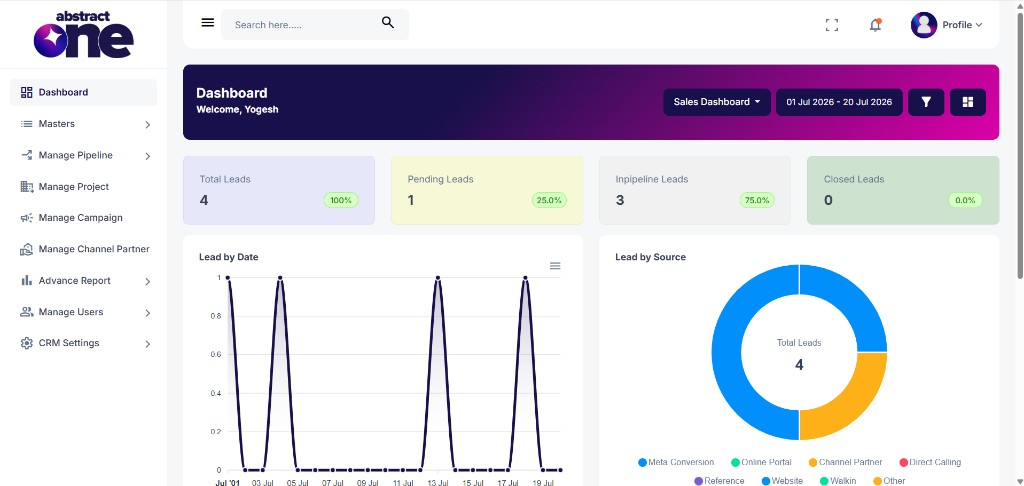
Dashboard Header
The top banner shows a welcome message and dashboard controls:
- Welcome message — displays the logged-in user name
- Sales Dashboard dropdown — switch between available dashboard views (e.g. Sales Dashboard, My Dashboard)
- Date range — shows the active report period
- Filter icon — open dashboard filters
- Customize icon — open dashboard customization drawer
Lead Summary Cards
The summary section shows high-level lead counts with percentage indicators:
| Card | Description |
|---|---|
| Total Leads | Total number of leads in the selected period |
| Pending Leads | Leads that are not yet attempted or processed |
| Inpipeline Leads | Leads currently in active pipeline stages |
| Closed Leads | Leads marked as closed in the selected period |
Dashboard Widgets
Below the summary cards, the dashboard displays analytics widgets. Available widgets include:
- Lead by Date — line chart showing lead activity over time
- Lead by Source — donut chart showing lead distribution by source (Meta Conversion, Online Portal, Channel Partner, Direct Calling, Reference, Website, Walkin, Other)
- Lead by Lead Type — breakdown of Hot, Cold, Warm, and Dead leads
- Lead by Dispositions — horizontal bar chart showing disposition-wise lead status (Interested, Not Interested, Not Contactable, Closed, Site visit)
- Site Visit Analytics — site visit performance visualization (optional widget)
- Lead Conversion Ratio — conversion performance visualization (optional widget)
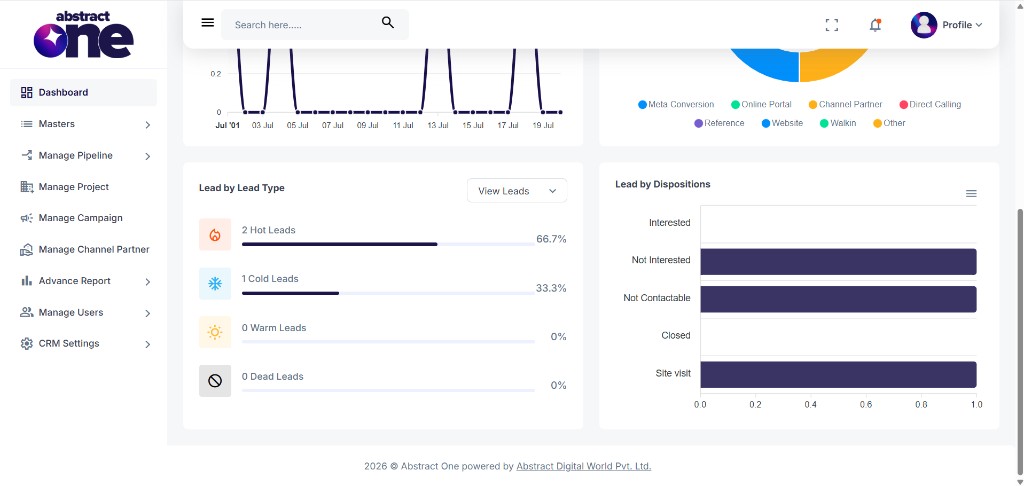
Some chart widgets include a menu icon to access additional chart actions such as download or export options.
Filter Dashboard
Click the Filter icon from the dashboard header to open the Filter Dashboard drawer.
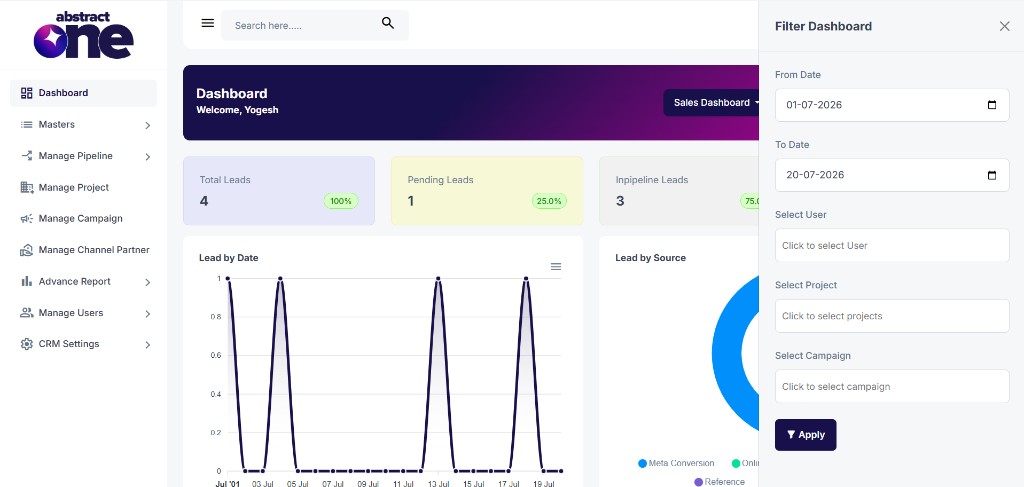
Available filters include:
| Filter | Description |
|---|---|
| From Date | Start date for dashboard data |
| To Date | End date for dashboard data |
| Select User | Filter dashboard metrics for one or more users |
| Select Project | Filter dashboard metrics by project |
| Select Campaign | Filter dashboard metrics by campaign |
Click Apply to refresh all dashboard cards and charts based on the selected filters.
Customize Dashboard
Click the Customize icon from the dashboard header to open the Customize Dashboard drawer. You can create a new dashboard layout or edit an existing one.
Option 1 — Create New Dashboard
Select Create New, enter a Template Name, and enable or disable widgets using the toggle switches.
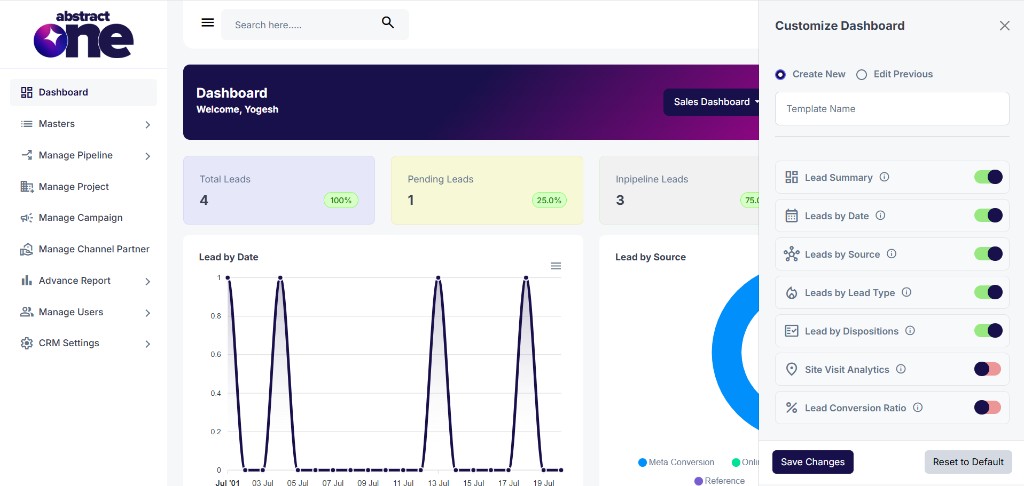
Option 2 — Edit Previous Dashboard
Select Edit Previous, choose an existing dashboard from the dropdown (e.g. Sales Dashboard, My Dashboard), and update widget visibility.
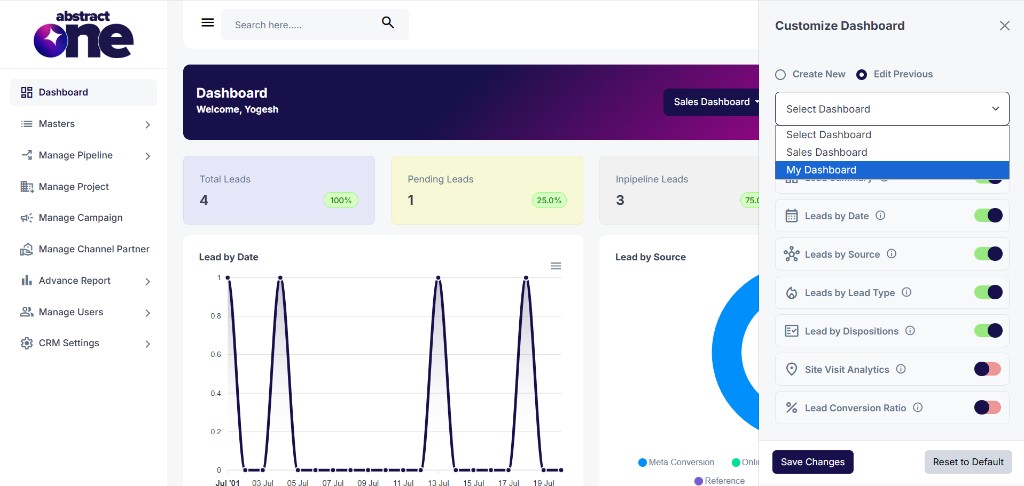
Available Widget Toggles
- Lead Summary
- Leads by Date
- Leads by Source
- Leads by Lead Type
- Lead by Dispositions
- Site Visit Analytics
- Lead Conversion Ratio
Click Save Changes to apply your customized layout. Use Reset to Default to restore the original dashboard widget configuration.
Important Notes
- Dashboard metrics update based on the selected date range and applied filters.
- Use filters to analyze performance by user, project, or campaign.
- Customize dashboard widgets to show only the reports most relevant to your role.
- Saved dashboard templates can be selected from the dashboard dropdown in the header.
- Lead summary percentages are calculated relative to total leads in the selected period.