

User Report
The User Report module allows you to view detailed performance analytics for an individual user, including lead overview, site visit status, and pipeline lead status. You can filter the report by date and campaign, and export the data to Excel.
From User Report, you can:
- View leads overview with total, inpipeline, pending, converted, and lost counts
- Analyze site visit status through a funnel chart
- Review pipeline leads status through a bar chart
- Filter the report by date range and campaign
- Export the user report to Excel
Access User Report
Go to:
Sidebar → Advance Report → User Report
From the User Report list, click the view action for a user to open the User Individual Report page. Breadcrumb: Dashboard → Report → User Individual Report.
User Profile Card
The right sidebar displays the selected user’s profile and action buttons:
| Field | Description |
|---|---|
| Name | Name of the user |
| Role | User role (e.g. Pre Sales) |
| Mo.Number | Mobile number of the user |
| Email address of the user | |
| Join Date | Date when the user joined |
| Status | Current user status (Active or Inactive) |
Two action buttons are available below the profile:
- Filter User Report — Open filter options to refine report data
- Export User Report — Download the report to Excel
Leads Overview
The top section shows a donut chart and summary cards with lead counts for the selected user.
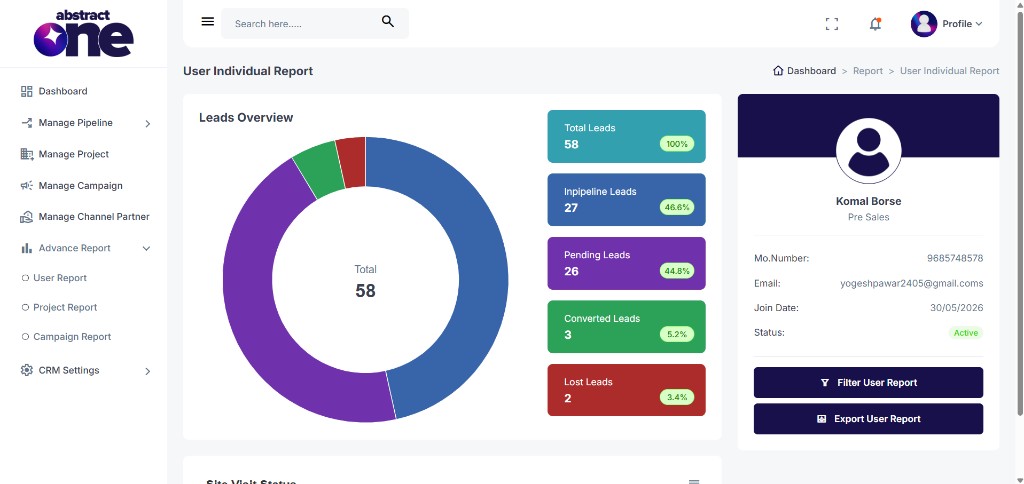
| Metric | Description |
|---|---|
| Total Leads | Total number of leads assigned to the user |
| Inpipeline Leads | Leads currently active in the pipeline |
| Pending Leads | Leads that have not been attempted yet |
| Converted Leads | Leads that have been converted or booked |
| Lost Leads | Leads marked as lost |
Site Visit Status
A funnel chart displays the site visit breakdown for the user, showing counts at each stage.
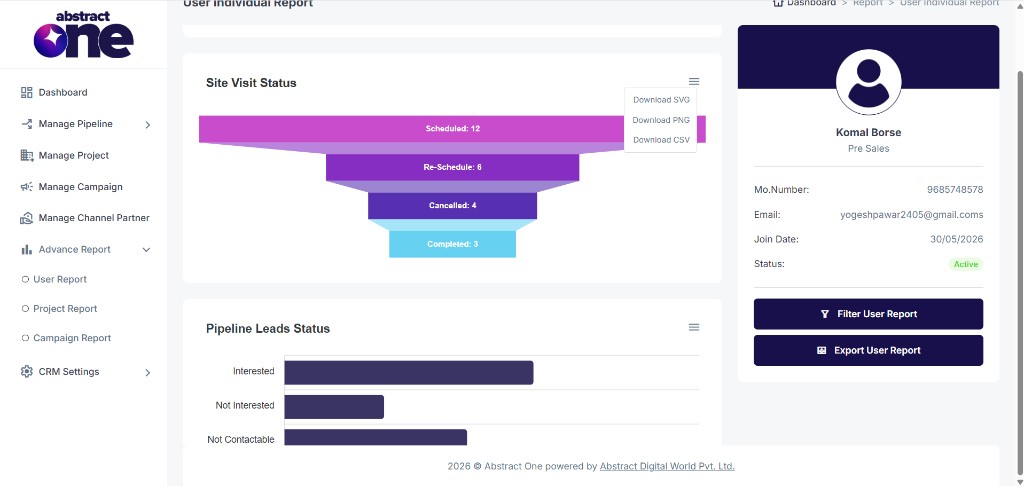
Each chart widget includes a menu icon (☰) in the top right with download options:
- Download SVG
- Download PNG
- Download CSV
Pipeline Leads Status
A horizontal bar chart shows the distribution of leads by disposition status for the user.
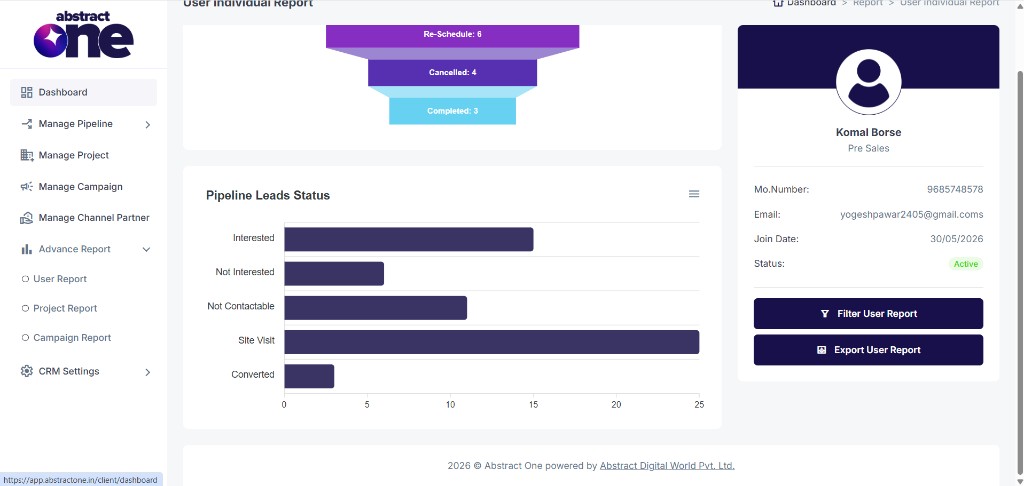
Disposition categories include Interested, Not Interested, Not Contactable, Site Visit, and Converted. The same download options (SVG, PNG, CSV) are available from the chart menu.
Filter User Report
Click the Filter User Report button on the user profile card to open the Filter Users drawer.
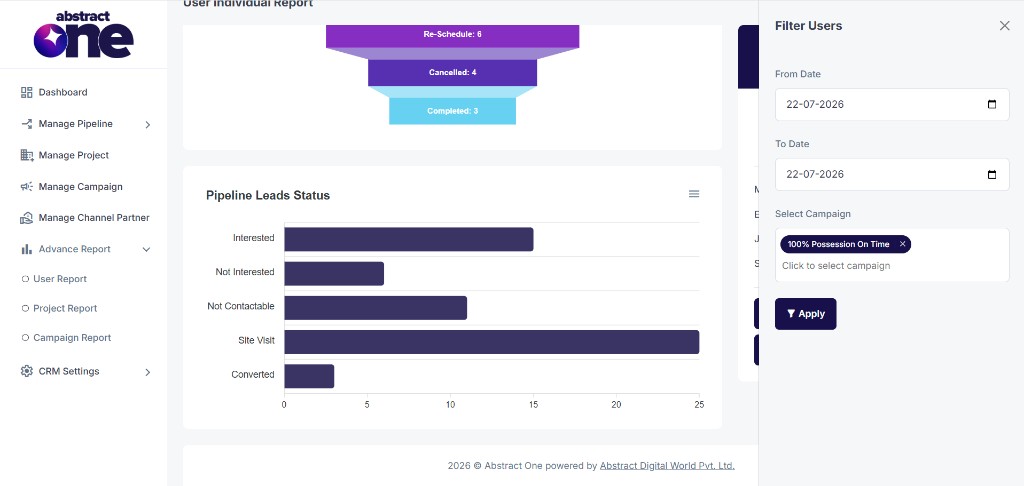
Available filter fields:
| Field | Description |
|---|---|
| From Date | Start date for the report date range |
| To Date | End date for the report date range |
| Select Campaign | Filter report data by one or more campaigns |
Click Apply to update the report based on your filter selections.
Export User Report
Click the Export User Report button on the user profile card to download a detailed Excel sheet of the user’s report data.
Important Notes
- The User Individual Report shows data only for the selected user.
- All charts and metrics update based on applied date and campaign filters.
- Chart widgets support SVG, PNG, and CSV downloads for individual visualizations.
- You don’t have access to multiple features in Advance Report as they are restricted by the Superadmin. Some report sections or actions may not be visible or available depending on your role and permissions set by the Superadmin.